Underground Power Cables - District Office Renos Prentzas
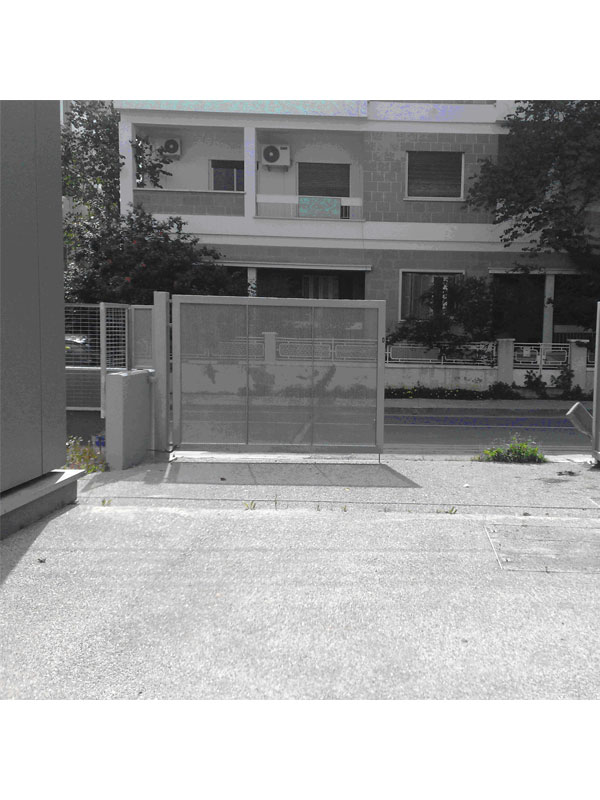
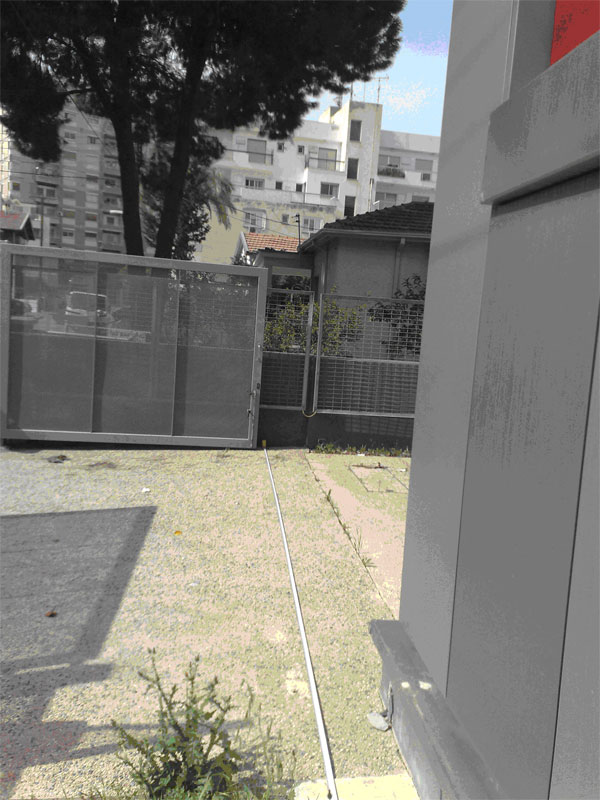
The measurements were performed on the 08th of March 2010 at 13:00 am during cloudy weather conditions. The EMF measurements were performed in the area located above the underground cable “District Office-Renos Prentzas”. The following figures provide pictures of the area where EMF measurements were recorded.

|

|
The underground cables are rated at a nominal voltage of 132 kV and a maximum current capacity of 800A. At the time when the measurements were performed, the load of the underground cable “District Office-Renos Prentzas” was 140 A which represents the 17.5% of its maximum current capacity.
Limiting exposure values have been provided by the ICNIRP recommendations and are guidelines to many countries and organizations. The exposure limits at 50 Hz are tabulated in the following table according to the limits given by ICNIRP.
|
Reference levels for Occupational exposure ICNIRP |
|||
|
Frequency |
Electric Field Strength, E (V/m) |
Magnetic Field Strength, H (A/m) |
Magnetic Flux Density, B (µT) |
|
50 Hz |
10000 |
400 |
500 |
|
Reference levels for General Public exposure ICNIRP |
|||
|
Frequency |
Electric Field Strength, E (V/m) |
Magnetic Field Strength, H (A/m) |
Magnetic Flux Density, B (µT) |
|
50 Hz |
5000 |
80 |
100 |
Table 1: ICNIRP exposure limits for Occupational and General Public exposure
The maximum obtained values are represented below and compared to the ICNIRP specified limits of General Public standards. The highest magnetic field was observed directly above the underground cable, with a value 1.60 μT (7 m away from the starting point) and a percentage of 1.60 % as compared to the ICNIRP General Public standard.
The following table summarizes the highest recorded measured values.
|
Maximum Magnetic Field Measurements |
||||||
|
Measurement Point |
Maximum Magnetic Field (µT) at Z Height (m) |
|||||
|
0.3m |
ICNIRP % |
1 m |
ICNIRP % |
1.75 m |
ICNIRP % |
|
|
Measurements along the underground cable |
||||||
|
7m Measurement Line |
1.60 |
1.60% |
0.77 |
0.77% |
0.50 |
0.50% |
|
Measurements across the underground cable |
||||||
|
8m Measurement Line |
1.23 |
1.23% |
0.54 |
0.54% |
0.35 |
0.35% |
Table 2: Maximum Field Measurements
The highest electric field was observed above the underground cable, with a value 2.82 V/m (5 m away from the starting point) and a percentage of 0.06 % as compared to the ICNIRP General Public standard.
The following table summarizes the highest recorded measured values.
|
Maximum Electric Field Measurements |
||||||
|
Measurement Point |
Maximum Electric Field (V/m) at Z Height (m) |
|||||
|
0.3m |
ICNIRP % |
1 m |
ICNIRP % |
1.75 m |
ICNIRP % |
|
|
Measurements along the underground cable |
||||||
|
5.5m Measurement Line |
-- |
-- |
1.37 |
0.03% |
1.96 |
0.04% |
|
Measurements across the underground cable |
||||||
|
5m Measurement Line |
-- |
-- |
1.43 |
0.03% |
2.82 |
0.06% |
Table 3: Maximum Electric Field Measurements