Substation SEK - PEO 5, Foteinou Pana Street
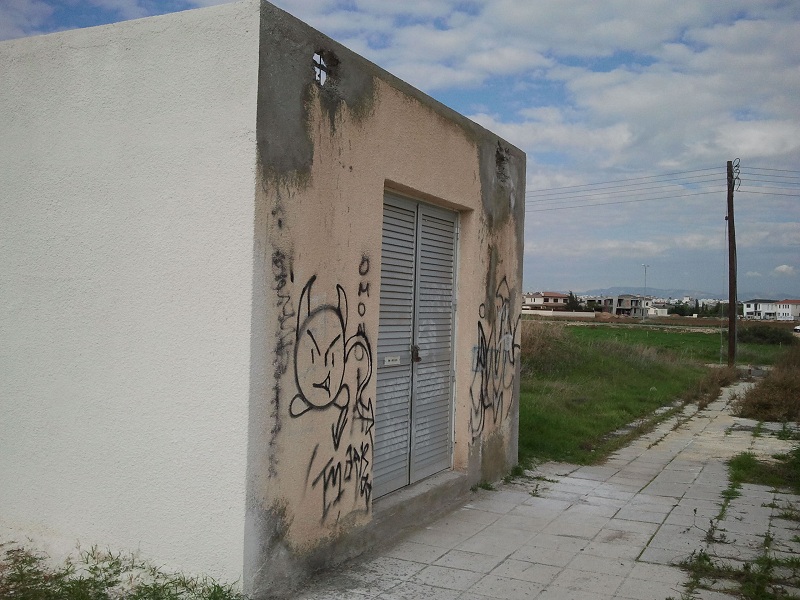
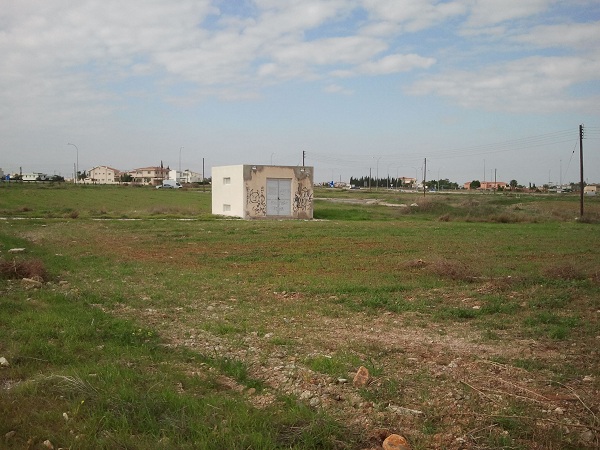
The measurements were performed on the 28th November 2012 at 09:30 a.m. during cloudy weather conditions. The EMF measurements were performed for the residence "Foteinou Pana street" and substation "SEK - PEO 5" in Nicosia. The following gures provide pictures of the area where EMF measuremets were recorded.
|
|
|
|
Figure 1: Front side of substation SEK - PEO 5 |
Figure 2: Substation SEK - PEO 5 |
The substation is rated at a nominal power of 200 KVA. At the time when the measurements were performed the substation load was recorded as:
|
Red Phase |
Yellow Phase |
Blue Phase |
|
10A |
10A |
18A |
Table 1: Measured load current
From the resultant load of all three phases as shown above we note that the load is only 4.37 % of the nominal load (200 KVA Transformer).It must therefore be noted that during the summer or in periods of peak load this will directly affect and produce an increase to the electric and magnetic fields.
Limiting exposure values have been provided by the ICNIRP recommendations and are guidelines to many countries and organizations. The exposure limits at 50 Hz are tabulated in the following table according to the limits given by ICNIRP.
|
Reference levels for Occupational exposure ICNIRP |
|||
|
Frequency |
Electric Field Strength, E (V/m) |
Magnetic Field Strength, H (A/m) |
Magnetic Flux Density, B (µT) |
|
50 Hz |
10000 |
400 |
500 |
|
Reference levels for General Public exposure ICNIRP |
|||
|
Frequency |
Electric Field Strength, E (V/m) |
Magnetic Field Strength, H (A/m) |
Magnetic Flux Density, B (µT) |
|
50 Hz |
5000 |
80 |
100 |
Table 2: ICNIRP Exposure limits for Occupational and General Public exposure
The highest magnetic eld measurement was observed at the right side of the substation at a height of 1 m (1 m from the starting point). The measured value at this point was 0.803µT and a persentage of 0.803% as compared to the INCIRP General Public stantard.
A detailed description of the maximum measured magnetic fields in the area under investigation is shown in the following table.
|
Magnetic Field Measurements |
||||||
|
Distance from Side /m |
Maximum Magnetic Field at Z Height /m - Percentage of ICNIRP General Public Standard /% |
|||||
|
0.3m |
ICNIRP % |
1m |
ICNIRP % |
1.75m |
ICNIRP % |
|
|
Substation front side - Mesh - Maximum values per line |
||||||
|
M.L. 0m away from Substation front side |
0.127 |
0.127% |
0.183 |
0.183% |
0.193 |
0.193% |
|
M.L. 1m away from Substation front side |
0.073 |
0.073% |
0.064 |
0.064% |
0.046 |
0.046% |
|
M.L. 2m away from Substation front side |
0.047 |
0.047% |
0.048 |
0.048% |
0.035 |
0.035% |
|
Substation left side - Mesh - Maximum values per line |
||||||
|
M.L. 0m away from Substation lef side |
0.161 |
0.161% |
0.156 |
0.156% |
0.135 |
0.135% |
|
M.L. 1m away from Substation left side |
0.074 |
0.074% |
0.049 |
0.049% |
0.051 |
0.051% |
|
M.L. 2m away from Substation left side |
0.077 |
0.077% |
0.042 |
0.042% |
0.057 |
0.057% |
|
M.L. 0m away from Substation right side |
0.634 |
0.634% |
0.803 |
0.803% |
0.469 |
0.469% |
|
M.L. 1m away from Substation right side |
0.139 |
0.139% |
0.090 |
0.090% |
0.089 |
0.089% |
|
M.L. 2m away from Substation right side |
0.430 |
0.430% |
0.048 |
0.048% |
0.046 |
0.046% |
Table 3: Maximum Magnetic Field Measurements.
The highest electric field measurement in the outside area was observed in the front side of the substation at height 1m. The measured value at this point was 0.754 V/m and a percentage of 0.015% as compared to the ICNIRP General Public standard.
|
Outside Field Measurements |
||||||
|
Measurement Point |
Maximum Electric Field at Z Height /m - Percentage of ICNIRP General Public Standard /% |
|||||
|
0.3m |
ICNIRP % |
1m |
ICNIRP % |
1.75m |
ICNIRP % |
|
|
Substation Front side - Maximum point measurements |
||||||
|
Measurement Point A |
-- |
-- |
0.754 |
0.015% |
-- |
-- |
|
Substation Left side - Maximum point measurements |
||||||
|
Measurement Point B |
-- |
-- |
0.636 |
0.013% |
-- |
-- |
|
Substation Right side - Maximum point measurements |
||||||
|
Measurement Point C |
-- |
-- |
0.639 |
0.013% |
-- |
-- |
Table 4: Electric Field Measurements.

