Miscellaneous - Underfloor Heating System
Underfloor Heating System - Turned off
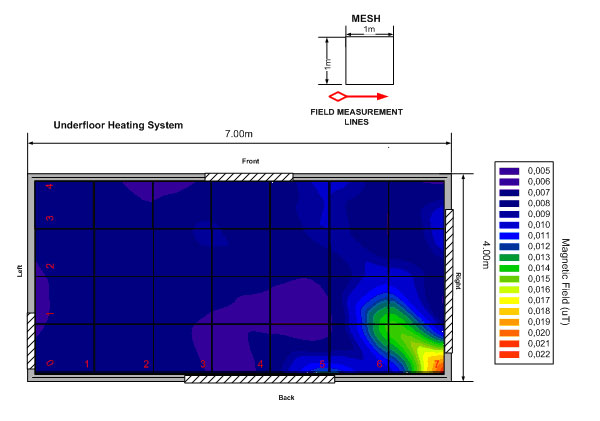
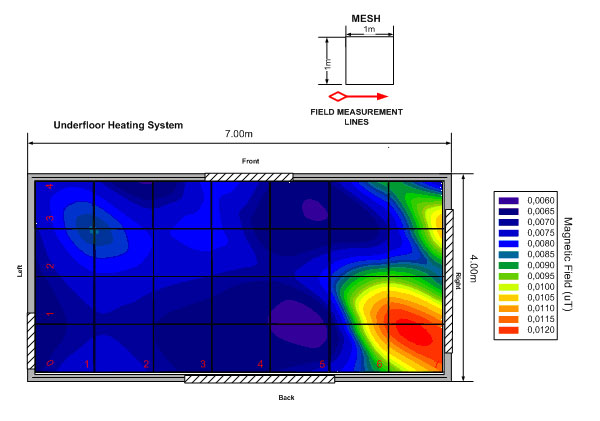
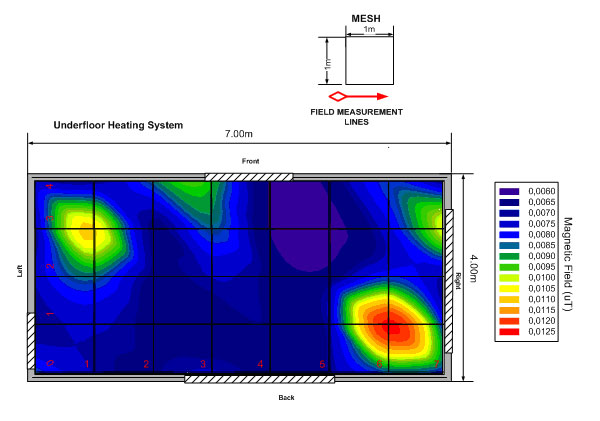
The measurements obtained are tabulated and represented in this section. The data is organized according to the position of the location (x, y and z levels). At first measurements were performed when the Underfloor Heating System was turn off. The following contour plots show the magnetic field distribution above the Underfloor Heating System, at 0.3m, 1m and 1.75m height respectively.
 |
 |
 |
Contour plot of Magnetic Field (µT) on the area above the Underfloor Heating System at 0.3m Height |
Contour plot of Magnetic Field (µT) on the area above the Underfloor Heating System at 1m Height |
Contour plot of Magnetic Field (µT) on the area above the Underfloor Heating System at 1.75m Height |
Underfloor Heating System - Turned on
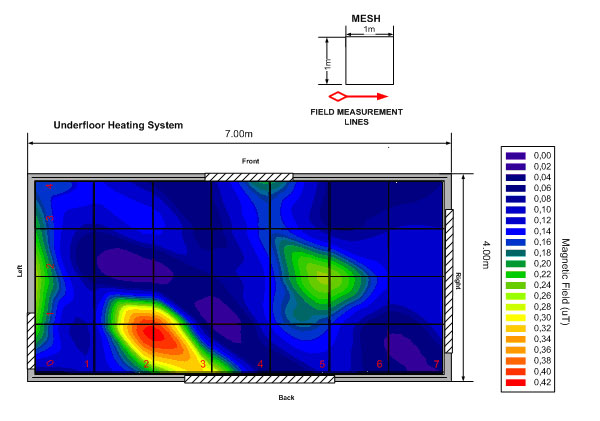
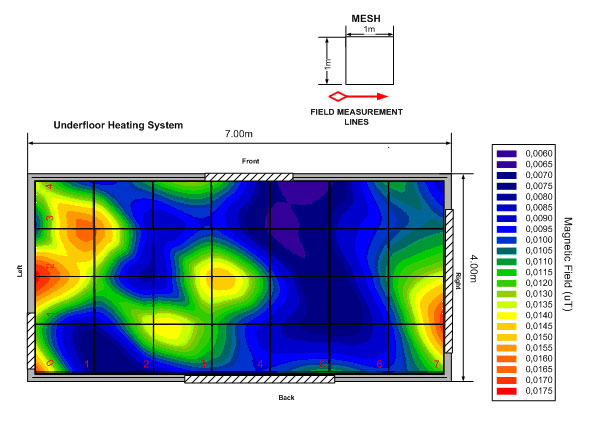
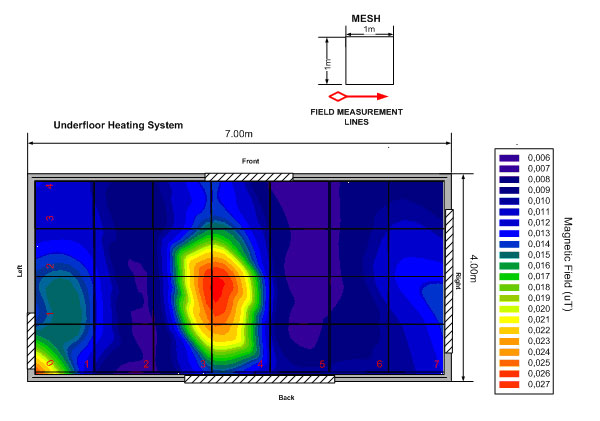
Finally, measurements were performed when the Underfloor Heating System was turn on. The following contour plots show the magnetic field distribution above the Underfloor Heating System, at 0.3m, 1m and 1.75m height respectively.
 |
 |
 |
|
Contour plot of Magnetic Field (µT) on the area above the Underfloor Heating System at 0.3m Height |
Contour plot of Magnetic Field (µT) on the area above the Underfloor Heating System at 1m Height |
Contour plot of Magnetic Field (µT) on the area above the Underfloor Heating System at 1.75m Height |