Substation - EAC 132 - 11 kV Omonoia Substation
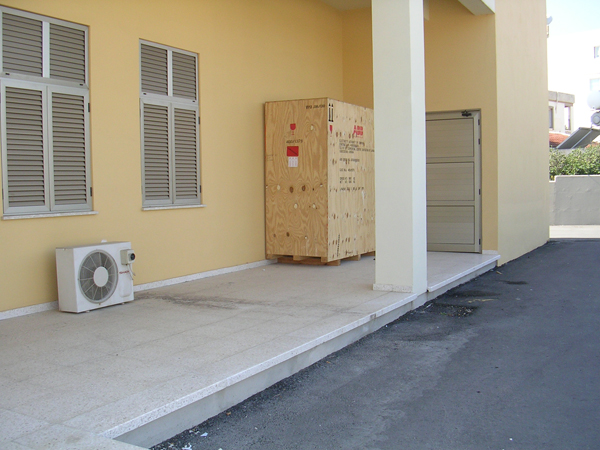
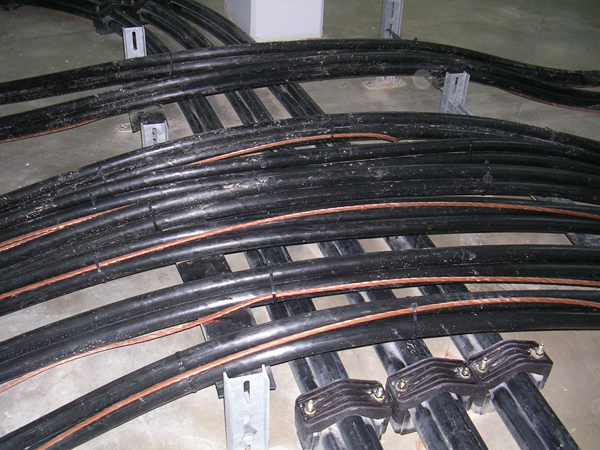
The measured substation is located in Omonoia area in Limassol. The measurements were performed on the 24th of October 2008 at 11:00 am. The EAC 132-11 kV Substation in Omonoia comprises of a main building which includes a basement where the incoming and outgoing cables are mounted, three rooms where the transformers are located, a room where the incoming and outgoing switchgear breakers are installed and a working area with the control rooms of the substation. In direct proximity to the substation are a number of houses and shops.
 |
 |
Limiting exposure values have been provided by the ICNIRP recommendations and are guidelines to many countries and organisations. The exposure limits at 50 Hz are tabulated in the following table according to the limits given by ICNIRP.
|
Reference levels for Occupational exposure ICNIRP |
|||
|
Frequency |
Electric Field Strength, E (V/m) |
Magnetic Field Strength, H (A/m) |
Magnetic Flux Density, B (µT) |
|
50 Hz |
10000 |
400 |
500 |
|
Reference levels for General Public exposure ICNIRP |
|||
|
Frequency |
Electric Field Strength, E (V/m) |
Magnetic Field Strength, H (A/m) |
Magnetic Flux Density, B (µT) |
|
50 Hz |
5000 |
80 |
100 |
Table 1: ICNIRP exposure limits for Occupational and General public exposure
The power as measured from the two operating transformers, at the time when the measurements were performed is listed below:
|
Time |
Transformer 1 Power [MW] |
Transformer 2 Power [MW] |
|
11:40 am |
4.5 |
7.4 |
Table 2: Maximum Power consumption recorded during EMF measurements for substation Omonoia
The power transformers have an operating capacity of 30 MW and a full power capacity of 40 MW with the fans operating.
The highest magnetic field inside the substation was observed in the Transformer 2 room (in front of the 11 kV cable side), with a value 461.7 µT and a percentage of 92.34% as compared to the ICNIRP Occupational standard. Accordingly the Magnetic Field measurements taken both inside and outside the power station are summarized in the following tables.
|
Substation : Inside Maximum Field Measurements |
||||||
|
Distance from Side (m) |
Maximum Magnetic Field (µT) at Z Height (m) |
|||||
|
0.3m |
ICNIRP % |
1 m |
ICNIRP % |
1.75 m |
ICNIRP % |
|
|
Control room 11 kV |
||||||
|
Incomer 2 |
-- |
-- |
-- |
-- |
49.60 |
9.92% |
|
Power factor correction room |
||||||
|
Room |
-- |
-- |
0.19 |
0.04% |
-- |
-- |
|
Transformer room 1 |
||||||
|
Transformer 1 - 11kv |
400.6 |
80.12% |
-- |
-- |
-- |
-- |
|
Transformer room 2 |
||||||
|
Transformer 2 - 11kv |
461.7 |
92.34% |
-- |
-- |
-- |
-- |
|
Incoming - Outgoing cables |
||||||
|
11 - 132 kV cables |
67.0 |
13.40% |
-- |
-- |
-- |
-- |
|
Control room 132 kV |
||||||
|
Point A |
19.28 |
3.86% |
|
|
|
|
Table 3: Maximum Magnetic Field measurements inside power station
Accordingly the highest magnetic field value outside the substation was observed at the right border side (at a height of 0.3m), with value 2.66 µT and a percentage of 2.66 % as compared to the ICNIRP General Public standard.
|
Substation : Outside Maximum Field Measurements |
||||||
|
Distance from Side (m) |
Maximum Magnetic Field (µT) at Z Height (m) |
|||||
|
0.3m |
ICNIRP % |
1 m |
ICNIRP % |
1.75 m |
ICNIRP % |
|
|
Outside substation |
||||||
|
Left outside wall |
0.95 |
0.95% |
-- |
-- |
-- |
-- |
|
Front outside wall |
0.51 |
0.51% |
-- |
-- |
-- |
-- |
|
Right outside wall |
4.68 |
4.68% |
-- |
-- |
-- |
-- |
|
Back outside wall |
0.41 |
0.41% |
-- |
-- |
-- |
-- |
|
Other outside wall |
2.66 |
2.66% |
-- |
-- |
-- |
-- |
Table 4: Maximum Magnetic Field measurements outside power station