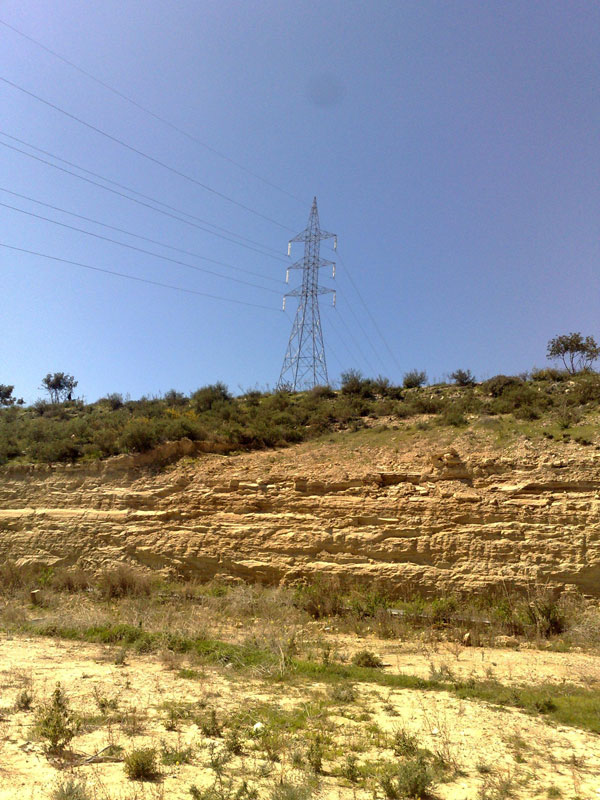
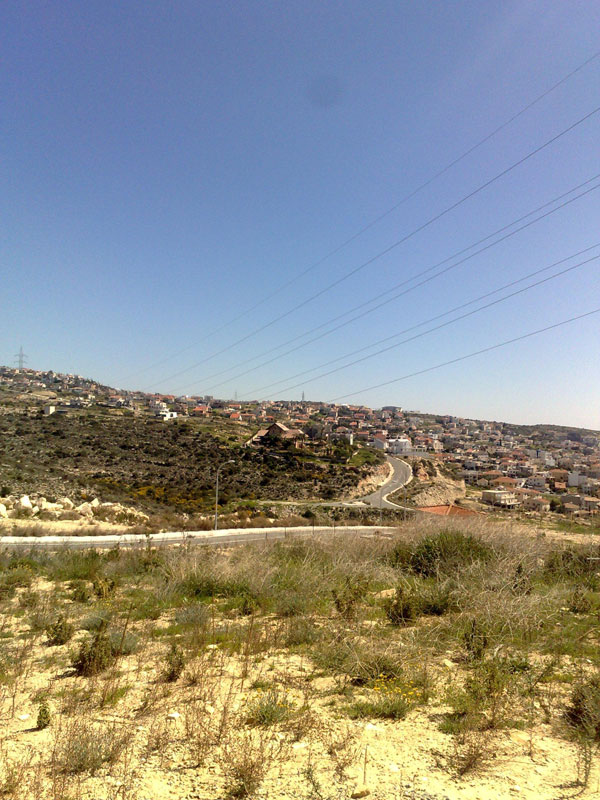
High Voltage Overhead Power Lines - Dokimos area in Agia Fyla, Limassol
The measurements were performed on the 26th of March 2011 at 10:30 am. The EMF measurements were performed inside the plot area in direct proximity to the overhead power line. The following figures provide pictures of the area where EMF measurements were recorded.
 |
 |
Limiting exposure values have been provided by the ICNIRP recommendations and are guidelines to many countries and organisations. The exposure limits at 50 Hz are tabulated in the following table according to the limits given by ICNIRP.
|
Reference levels for Occupational exposure ICNIRP |
|||
|
Frequency |
Electric Field Strength, E (V/m) |
Magnetic Field Strength, H (A/m) |
Magnetic Flux Density, B (µT) |
|
50 Hz |
10000 |
400 |
500 |
|
Reference levels for General Public exposure ICNIRP |
|||
|
Frequency |
Electric Field Strength, E (V/m) |
Magnetic Field Strength, H (A/m) |
Magnetic Flux Density, B (µT) |
|
50 Hz |
5000 |
80 |
100 |
Table 1: ICNIRP exposure limits for Occupational and General public exposure
The overhead power line is rated at a nominal power of 290 MVA. At the time when the measurements were performed, the load of the overhead power line was 38 MW and 4 MVar.
The Resultant Load of all three phases was 13.16% utilization of the nominal load power.
The maximum obtained magnetic field values are represented below and compared to the ICNIRP specified limits for the General Public. The highest magnetic field value was observed while performing the measurements in parallel with the overhead power lines (7m from the starting point at height 0.3m), with a value 0.13 μT and a percentage of 0.13 % as compared to the ICNIRP General Public standard.
The following table summarizes the magnetic field measurements taken in area under investigation.
|
Magnetic Field Measurements |
||||||
|
Distance /m |
Maximum Magnetic Field (μT) at Z Height /m - Percentage of ICNIRP General Public Standard /% |
|||||
|
0.3m |
ICNIRP % |
1m |
ICNIRP % |
1.75m |
ICNIRP % |
|
|
EMF Field Measurements - Line Measurements in parallel with the overhead power lines |
||||||
|
11m Measurement line |
0.13 |
0.13% |
0.12 |
0.12% |
0.10 |
0.10% |
|
EMF Field Measurements - Line Measurements perpendicular to the overhead power lines |
||||||
| 11m Measurement line |
0.08 |
0.08% |
0.08 |
0.08% |
0.10 |
0.10% |
Table 2: Magnetic Field Measurements
Accordingly, the maximum obtained electric field values are represented below and compared to the ICNIRP specified limits for the General Public. The highest electric field value was observed while performing the measurements in parallel with the overhead power lines (11m from the starting point at height 1.75m), with a value 15.47 V/m and a percentage of 0.309 % as compared to the ICNIRP General Public standard.
The following table summarizes the electric field measurements taken in the area under investigation.
|
Electric Field Measurements |
||||||
|
Distance /m |
Maximum Electric Field (V/m) at Z Height /m - Percentage of ICNIRP General Public Standard /% |
|||||
|
0.3m |
ICNIRP % |
1m |
ICNIRP % |
1.75m |
ICNIRP % |
|
|
EMF Field Measurements - Line Measurements in parallel with the overhead power lines |
||||||
|
11m Measurement line |
-- |
-- |
15.32 |
0.31% |
15.47 |
0.31% |
|
EMF Field Measurements - Line Measurements perpendicular to the overhead power lines |
||||||
|
11m Measurement line |
-- |
-- |
15.28 |
0.31% |
14.90 |
0.30% |
Table 3: Electric Field Measurements