Substation - Substation Varosia 1, Foteinou Pana Street
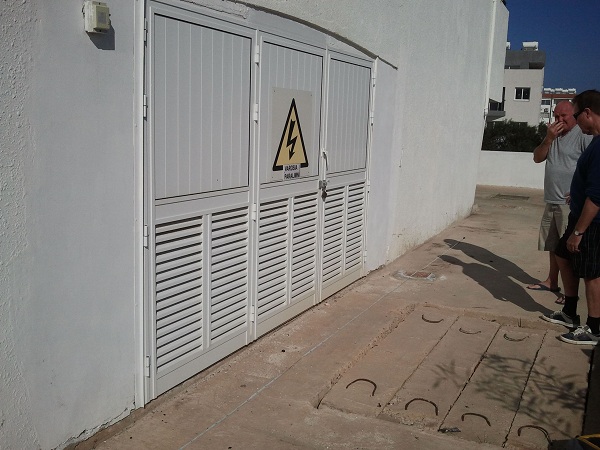
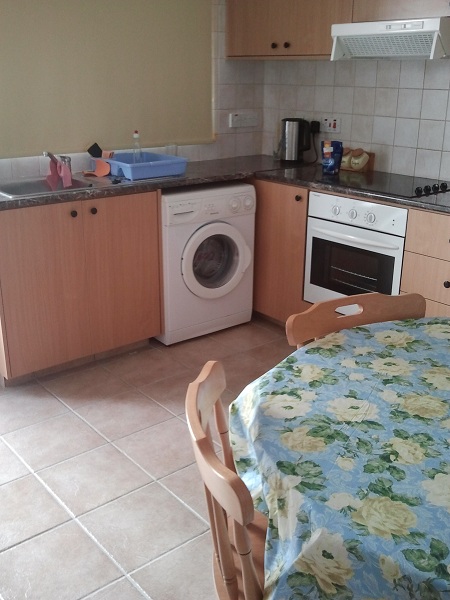
The measured residence and substation are located in Michail Kaili Street, Paralimni, Famagusta District. The measurements were performed on the 27th of November 2012 during clear weather conditions and started at 10:00 am.
|
|
|
|
Figure 1: Substation Varosia 1 |
Figure 2: Residence in direct proximity |
Limiting exposure values have been provided by the ICNIRP recommendations and are guidelines to many countries and organizations. The exposure limits at 50 Hz are tabulated in the following table according to the limits given by ICNIRP.
|
Reference levels for Occupational exposure ICNIRP |
|||
|
Frequency |
Electric Field Strength, E (V/m) |
Magnetic Field Strength, H (A/m) |
Magnetic Flux Density, B (µT) |
|
50 Hz |
10000 |
400 |
500 |
|
Reference levels for General Public exposure ICNIRP |
|||
|
Frequency |
Electric Field Strength, E (V/m) |
Magnetic Field Strength, H (A/m) |
Magnetic Flux Density, B (µT) |
|
50 Hz |
5000 |
80 |
100 |
Table 1: ICNIRP Exposure limits for Occupational and General Public exposure
The highest magnetic field measurement was observed at the right side (Side B) of the substation at a height of 1.75m (3m from the starting point). The measured value at this point was 1.477µT and a percentage of 1.477% as compared to the ICNIRP General Public standard.
A detailed description of the maximum measured magnetic fields in the area under investigation is shown in the following table.
|
Magnetic Field Measurements |
||||||
|
Distance from Side /m |
Maximum Magnetic Field at Z Height /m - Percentage of ICNIRP General Public Standard /% |
|||||
|
0.3m |
ICNIRP % |
1m |
ICNIRP % |
1.75m |
ICNIRP % |
|
|
Substation front side - Mesh - Maximum values per line |
||||||
|
M.L. 0m away from Substation front side |
0.267 |
0.267% |
0.129 |
0.128% |
0.122 |
0.122% |
|
M.L. 1m away from Substation front side |
0.261 |
0.261% |
0.105 |
0.105% |
0.074 |
0.074% |
|
M.L. 2m away from Substation front side |
0.230 |
0.230% |
0.104 |
0.104% |
0.069 |
0.069% |
|
Substation left side - Side A - Mesh - Maximum values per line |
||||||
|
M.L. 0.5m away from Substation lef side |
0.104 |
0.104% |
0.088 |
0.088% |
0.060 |
0.060% |
|
M.L. 1m away from Substation left side |
0.075 |
0.075% |
0.111 |
0.111% |
0.104 |
0.104% |
|
Substation left side - Side B - Mesh - Maximum values per line |
||||||
|
M.L. 0m away from Substation left side |
0.166 |
0.166% |
0.098 |
0.098% |
0.089 |
0.089% |
|
M.L. 1m away from Substation left side |
0.065 |
0.065% |
0.067 |
0.067% |
0.070 |
0.070% |
|
Substation back side - Mesh - Maximum values per line |
||||||
|
M.L. 0m away from Substation back side |
0.111 |
0.111% |
0.212 |
0.212% |
0.188 |
0.188% |
|
M.L. 1m away from Substation back side |
0.143 |
0.143% |
0.307 |
0.307% |
0.351 |
0.351% |
|
M.L. 2m away from Substation back side |
0.080 |
0.080% |
0.094 |
0.094% |
0.126 |
0.126% |
|
Substation right side - Side A - Mesh - Maximum values per line |
||||||
|
M.L. 0m away from Substation right side |
0.105 |
0.105% |
0.065 |
0.065% |
0.081 |
0.081% |
|
M.L. 1m away from Substation right side |
0.166 |
0.166% |
0.049 |
0.049% |
0.037 |
0.037% |
|
Substation right side - Side B - Mesh - Maximum values per line |
||||||
|
M.L. 0m away from Substation right side |
0.211 |
0.211% |
1.468 |
1.468% |
1.477 |
1.477% |
|
M.L. 1m away from Substation right side |
0.085 |
0.085% |
0.137 |
0.137% |
0.203 |
0.203% |
|
M.L. 2m away from Substation right side |
0.061 |
0.061% |
0.049 |
0.049% |
0.100 |
0.100% |
|
Above Substation - Mesh - Maximum values per line |
||||||
|
M.L. 0m away from left veranda wall |
0.067 |
0.067% |
0.102 |
0.102% |
0.069 |
0.069% |
|
M.L. 1m away from left veranda wall |
0.076 |
0.076% |
0.085 |
0.085% |
0.091 |
0.091% |
|
M.L. 2m away from left veranda wall |
0.068 |
0.068% |
0.079 |
0.079% |
0.066 |
0.066% |
|
M.L. 3m away from left veranda wall |
0.087 |
0.087% |
0.063 |
0.063% |
0.073 |
0.073% |
|
M.L. 4m away from left veranda wall |
0.102 |
0.102% |
0.071 |
0.071% |
0.058 |
0.058% |
|
M.L. 5m away from left veranda wall |
0.085 |
0.085% |
0.061 |
0.061% |
0.072 |
0.072% |
|
Residence Kitchen - Point - Maximum values per line |
||||||
|
M.P.I |
-- |
-- |
0.039 |
0.039% |
-- |
-- |
|
Residence Bedroom - Point - Maximum values per line |
||||||
|
M.P.L |
-- |
-- |
0.041 |
0.041% |
-- |
-- |
|
Residence neighbour- Point - Maximum values per line |
||||||
|
M.P.O |
-- |
-- |
0.052 |
0.052% |
-- |
-- |
Table 2: Maximum Magnetic Field Measurements.
The highest electric field measurement was observed on the back side of the substation at height 1m. The measured value at this point was 43.89 V/m and a percentage of 0.878% as compared to the ICNIRP General Public standard.
|
Outside Field Measurements |
||||||
|
Measurement Point |
Maximum Electric Field at Z Height /m - Percentage of ICNIRP General Public Standard /% |
|||||
|
0.3m |
ICNIRP % |
1m |
ICNIRP % |
1.75m |
ICNIRP % |
|
|
Substation Front side - Maximum point measurements |
||||||
|
Measurement Point A |
-- |
-- |
0.619 |
0.012% |
-- |
-- |
|
Substation Left side - Maximum point measurements |
||||||
|
Measurement Point B |
-- |
-- |
0.856 |
0.017% |
-- |
-- |
|
Substation Back side - Maximum point measurements |
||||||
|
Measurement Point D |
-- |
-- |
0.892 |
0.018% |
-- |
-- |
|
Substation Right side - Maximum point measurements |
||||||
|
Measurement Point G |
-- |
-- |
0.691 |
0.014% |
-- |
-- |
|
Substation Back side - Maximum point measurements |
||||||
|
Measurement Point H |
-- |
-- |
0.696 |
0.014% |
-- |
-- |
Table 3: Electric Field Measurements.

